

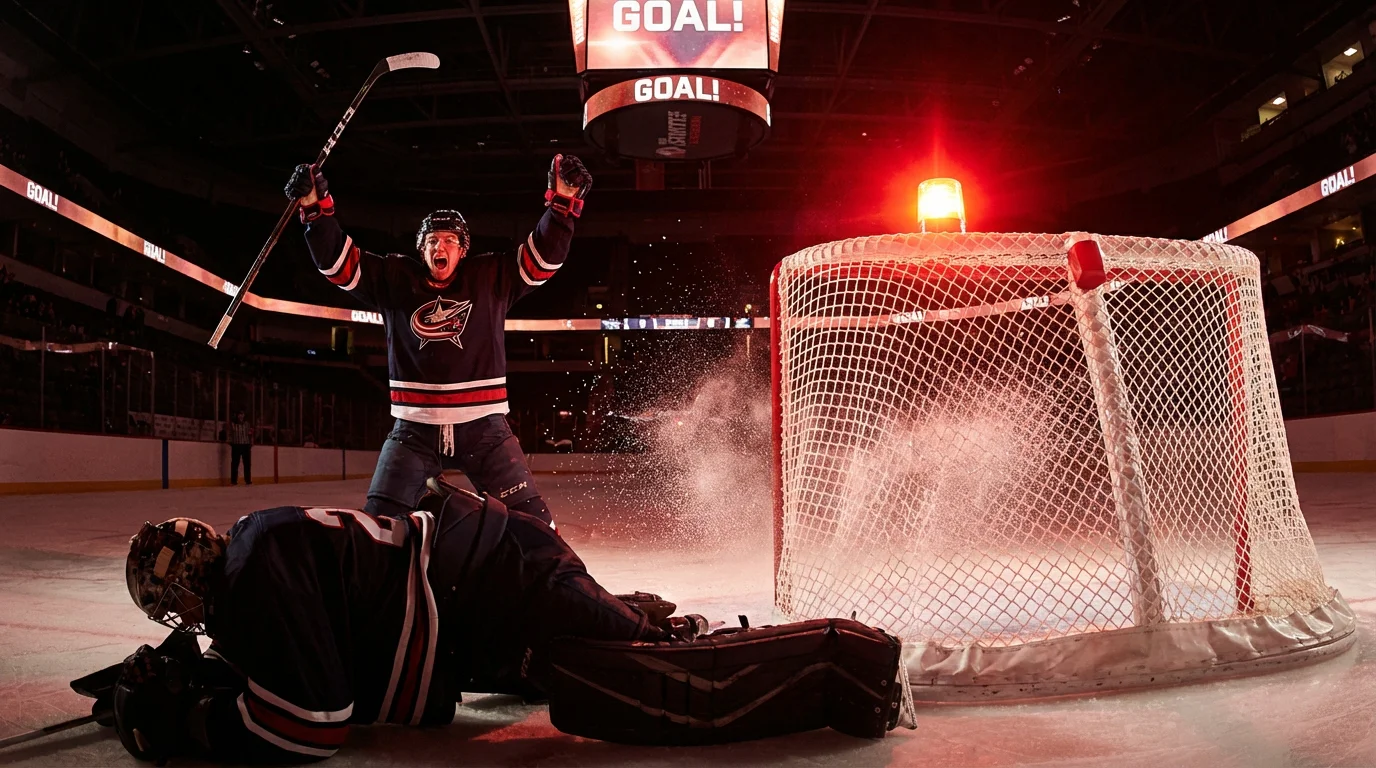
There is a specific rush that comes with betting a player to score and then watching him bury one in the second period. It is more personal than a moneyline win, more targeted than a totals hit. Goal scorer props connect you to individual performance in a way that game-level markets cannot match. But that emotional charge is also what makes these props dangerous for undisciplined bettors — the thrill of the bet can cloud the analysis behind it.
Goal scorer props are among the most popular player-level markets in NHL betting, and they come in several flavors. Understanding the differences between them, the factors that drive goal-scoring probability, and the spots where the market consistently misprices players is the path from recreational prop bettor to informed one.
Anytime, First & Last Goal Scorer Markets
The anytime goal scorer market is the most straightforward: will a specific player score at least one goal in the game? The odds vary by player, ranging from about +100 for the league’s most prolific snipers in favorable matchups to +500 or longer for bottom-six forwards and defensemen. The implied probabilities are roughly 50% for the shortest-priced players down to about 17% for the longest shots.
The anytime goal scorer market is the most forgiving of the three because you do not need to predict when the goal is scored — just that it happens at some point. This makes it the natural starting point for prop bettors because it isolates the core question (will he score?) without adding timing complexity.
The first goal scorer market asks you to identify the player who will score the opening goal of the game. Prices here are significantly longer — even elite forwards are typically priced at +700 or higher — because the pool of possible first goal scorers includes every skater on both teams. The implied probability for any individual player is low, usually in the 5-10% range, which means this is a high-variance, lottery-style bet. It is fun. It is not a reliable path to profitability unless you have identified systematic mispricing across a large sample.
The last goal scorer market is similar in structure to the first goal scorer but carries additional unpredictability. The last goal might be an empty-netter scored by a fourth-liner who would never be a top candidate in the anytime or first goal scorer markets. This randomness makes the last goal scorer market the noisiest of the three and the least suitable for systematic analysis.
For serious prop bettors, the anytime goal scorer market is where the edge lives. It offers the best balance of predictability, liquidity, and pricing efficiency — tight enough that the book takes it seriously, but loose enough that informed analysis can uncover value.
Shot Volume: The Engine Behind Goal Scoring
Goals are scarce events. Even the best scorers in the NHL convert roughly 12-15% of their shots on goal into goals over a full season. A player who averages 3.5 shots per game and converts at 13% scores approximately 0.45 goals per game — less than one every two games. This low conversion rate means that goal-scoring props are inherently volatile on a game-to-game basis, and the single most important predictor of whether a player scores on a given night is how many shots he puts on net.
Shot volume is stickier than shooting percentage. A player who averages 3.5 shots per game will hover near that number with reasonable consistency across a ten-game window. His shooting percentage, by contrast, will fluctuate wildly — he might go five games without scoring and then pot three in two nights. For prop betting, this means you should focus less on whether a player is “due” for a goal and more on whether the conditions of tonight’s game support a high shot volume.
The factors that drive individual shot volume include line placement, ice time, and offensive system. A player skating on the first line with high-end playmakers will see more offensive zone time and more shooting opportunities than the same player buried on the third line. Similarly, a player on a team that generates a high volume of shots at even strength will benefit from the system’s offensive structure, even if his personal talent level is not elite.
Power play deployment is a particularly important driver. Players on the first power-play unit receive concentrated offensive zone time with the man advantage, which translates directly into shot attempts. A player who averages three shots per game at even strength might average an additional one to two shots during power play time. If that player is on a team that draws penalties frequently, his total shot projection for the night increases, and with it, his probability of scoring.
Power Play Usage and Its Impact on Goal Scorer Props
The power play is the great amplifier of goal-scoring probability. A team on the man advantage generates scoring chances at a rate roughly three to four times higher than at even strength, and the players on the first power-play unit receive a disproportionate share of those opportunities. For goal scorer prop bettors, understanding a player’s power play role is not optional — it is the single most important contextual factor after shot volume.
First power-play unit deployment is the key variable. Not all power play time is equal. The first unit typically plays the first ninety seconds to two minutes of each power play, receiving the initial offensive zone setup and the highest-quality looks. The second unit enters after a rotation and often faces a penalty kill that has already established its structure. Players on the first unit score at a significantly higher rate per minute of power play time than players on the second unit, and the gap is large enough to affect anytime goal scorer pricing.
When evaluating a goal scorer prop, check the player’s power play deployment for the last five to ten games. Coaching changes, injuries, and performance fluctuations can shift a player from the first unit to the second — or off the power play entirely — without the prop market immediately adjusting. A player who was on PP1 last week but has been demoted to PP2 due to a cold streak might still be priced based on his recent scoring rate, which was inflated by first-unit opportunities he no longer has. That is a spot to fade. Conversely, a player who has recently been promoted to PP1 but whose goal scorer price has not shortened is a spot to bet.
The opposing team’s penalty kill also matters. Not all penalty kills are equal, and a player facing a bottom-five PK unit has a measurably higher probability of scoring a power play goal than the same player facing a top-five PK. Tracking PK rankings and incorporating them into your goal scorer projections adds a layer of specificity that the sportsbook’s generic pricing model may not fully capture.
Matchup-Based Edges: Exploiting Defensive Weaknesses
Beyond power play dynamics, the even-strength matchup creates exploitable edges in the goal scorer market. Not all defensemen defend equally, and not all defensive systems suppress scoring chances with the same effectiveness. Identifying the specific matchups that favor a goal scorer target is where the real work happens.
Start with the opposing team’s defensive pair matchups. In the NHL, coaches typically deploy their top defensive pair against the opponent’s top line. But not every top pair is elite. Some teams have a clear number-one pair that shuts down opposing stars and a weaker second pair that gives up space in the offensive zone. When a strong forward is projected to face the weaker pair — perhaps because of line matching, last-change dynamics, or the opponent’s coaching tendencies — his goal-scoring probability increases relative to his average.
Defensive structure at the team level also matters. Teams that play a collapsing, shot-blocking style suppress shots from the slot and force opponents to the perimeter. Teams that play an aggressive, high-pressure style create turnovers but also leave gaps in their defensive zone when the pressure fails. Forwards facing aggressive teams tend to get more odd-man rushes and more high-danger chances, both of which elevate goal-scoring probability.
Travel and fatigue compound these defensive weaknesses. A team on the second night of a back-to-back with a tired defensive corps is more likely to make coverage mistakes, lose body position in front of the net, and fail to clear rebounds. Targeting goal scorer props against fatigued opponents — especially in games where a strong offensive team is at home with its full lineup — creates a compounding edge: more shots, worse defense, and a higher probability per shot.
One practical approach is to build a simple lookup table that tracks goal-scoring rates for your target players against each opposing team over the last two seasons. Some forwards consistently produce against specific opponents — whether because of favorable matchups, system advantages, or simple stylistic preference — and these tendencies, while not guaranteed to persist, provide a useful baseline for identifying above-average goal-scoring spots.
Goal Scorer Props Reward Patience, Not Hunches
The biggest trap in goal scorer prop betting is anchoring on narrative. A player scored two goals last night, so he must be hot, so he is a good bet tonight. That logic feels right and is almost entirely wrong. Goal scoring in the NHL is far too volatile for short-term streaks to carry predictive value. A player who scored two goals last night is not meaningfully more likely to score tonight than he was two days ago when he was in a five-game drought.
What does carry predictive value is process. Shot volume, shot quality, power play deployment, defensive matchup, and game context — these are the inputs that move the needle on goal-scoring probability. A player whose shot rate has increased over the last ten games because he moved to the first line and the first power play unit is a better bet than a player who scored on a fluke deflection in his last game but is still skating on the third line with minimal PP time.
Build your prop process around repeatable inputs, not recent outcomes. Track shot rates, not goal streaks. Monitor line combinations and power play units, not highlight reels. And accept that even the best goal scorer prop analysis will lose more often than it wins — the hit rate on anytime goal scorers for most players is below 40%. Profitability comes from finding the spots where the true probability exceeds the implied probability by a wide enough margin to overcome the vig, and then betting those spots consistently across hundreds of games. The patience required is considerable. The payoff for those who maintain it is real.
