

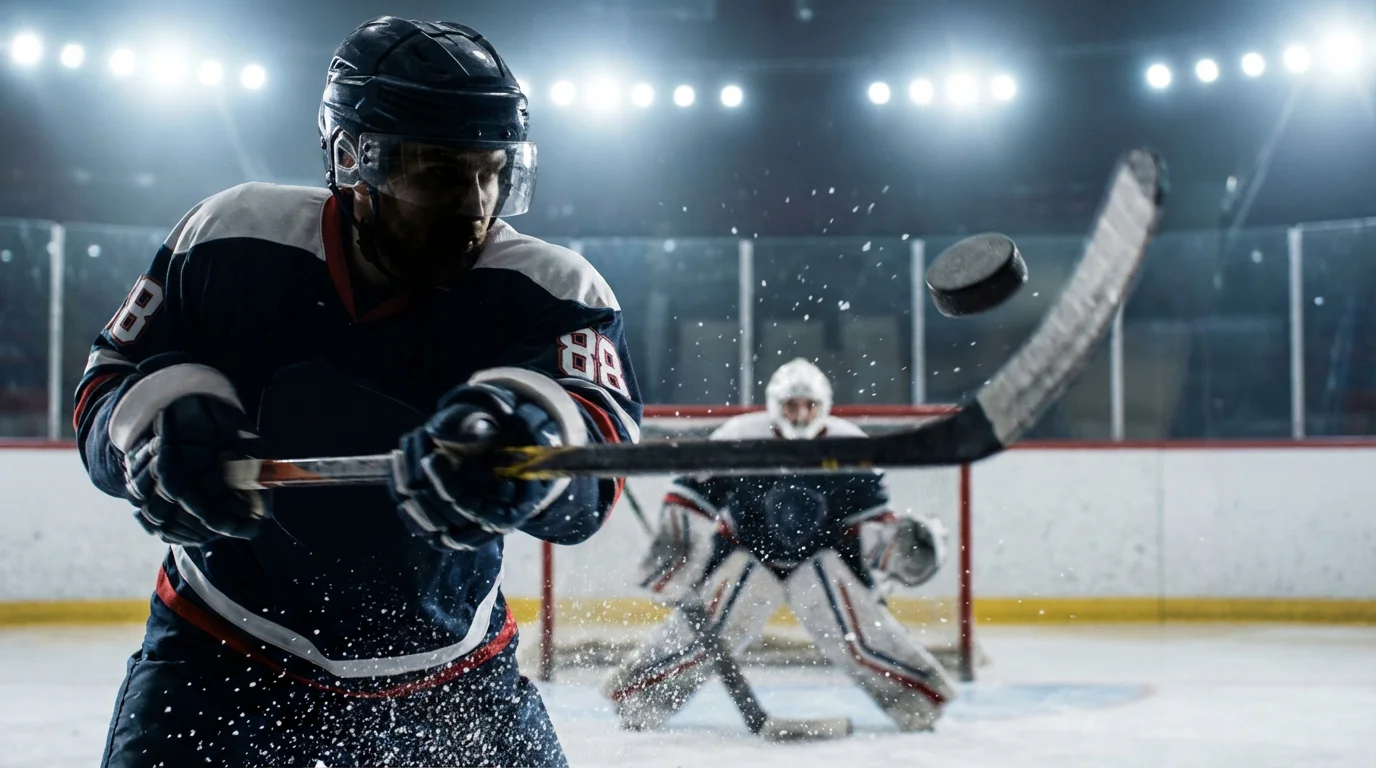
Shots on goal props are the quiet workhorses of the NHL prop market. They lack the glamour of goal scorer bets and the narrative appeal of point totals, but they offer something those markets do not: consistency. Shot volume is one of the most predictable individual statistics in hockey, and predictability is the raw material from which betting edges are built.
The concept is simple. A sportsbook posts an over/under on how many shots on goal a specific player will register, and you bet whether the actual number will be higher or lower. Lines typically range from 1.5 for lower-usage players to 4.5 or even 5.5 for the league’s highest-volume shooters. The pricing is usually juiced on one side — heavily toward the over for low-line players and more balanced for high-volume shooters — reflecting the book’s assessment of the most likely outcome.
What makes this market attractive for sharp bettors is that shot totals are driven by repeatable process factors — ice time, line placement, offensive system, and shooting tendencies — rather than the high-variance luck that governs goals. A player who averages 3.5 shots per game is far more likely to put up 3 or 4 shots tonight than a player who averages 0.3 goals per game is to score. This stability narrows the range of outcomes and makes projections more reliable, which is exactly what you want when you are trying to find a price that is wrong.
Predicting NHL Player Shot Volume
Several factors drive how many shots a player puts on goal in a given game, and understanding their relative importance is the foundation of profitable shot prop betting.
Ice time is the broadest driver. More minutes on the ice means more opportunities to shoot. Top-line forwards typically log 18-21 minutes per game, while third and fourth-line players log 10-14 minutes. All else being equal, the player with more ice time will generate more shots simply through volume of opportunity. Tracking ice time over the last five to ten games — rather than the season average — captures any recent shifts in deployment that the season number might mask.
Shooting rate — the number of shots a player generates per sixty minutes of ice time — is the more precise metric. It isolates the player’s individual tendency to put pucks on net, independent of how much ice time he receives. A player with a high shooting rate who receives increased ice time due to an injury to a teammate is a prime candidate for a shot prop over. His rate stays the same, but his opportunity increases.
The team’s offensive system matters as well. Some teams generate a high volume of shots through their structure — cycling the puck in the offensive zone, crashing the net, and creating second-chance opportunities. Players on these teams tend to have inflated shot numbers relative to their individual talent because the system funnels pucks toward the net. Other teams play a more selective, pass-first style that generates fewer total shots but higher-quality looks. Players on these teams may have lower shot totals but higher shooting percentages.
Power play time, as with goal scorer props, amplifies shot volume. A player on the first power-play unit will log additional shot attempts during man-advantage situations, and these shots are often from premium locations. When projecting a player’s shot total for the night, estimate his even-strength shot rate and then add his expected power-play shots based on the team’s projected penalty differential. A team that draws penalties at a high rate gives its power-play shooters more opportunities, which directly inflates the shot total.
How Defensive Matchups Affect Shot Props
The opposing team’s defensive structure is the second half of the shot prop equation. A player’s shot volume does not exist in a vacuum — it is shaped by how the opponent defends, how aggressively they pressure the puck, and how effectively they limit offensive zone time.
Teams that play a tight, collapsing defensive system — packing the middle of the ice and blocking lanes to the net — tend to suppress opponents’ shots on goal while allowing a higher number of blocked shots and missed attempts. Against these teams, a player’s Corsi (total shot attempts) might hold steady, but his shots on goal — the metric that shot props measure — may dip because more of his attempts are being deflected before reaching the goaltender. This distinction between shot attempts and shots on goal is important for prop bettors. A team with elite shot-blocking numbers will drag down the shot-on-goal totals for opposing forwards, even if those forwards are generating their usual volume of attempts.
Conversely, teams that play an aggressive, high-pressure style create transition opportunities that result in odd-man rushes, breakaways, and open shooting lanes. Against these teams, offensive players tend to get cleaner looks and register more shots on goal per attempt. The shooting percentage of attempts also tends to increase, but for shot prop purposes, the key insight is that more attempts reach the net, inflating the shots-on-goal number.
Travel between these defensive archetypes within the schedule matters for prop bettors. A player who just put up five shots against an aggressive, high-event team might see his prop line bumped to 3.5 for the next game, which happens to be against a shot-suppressing defensive team. If the book’s line is influenced by recency — the five-shot game — rather than the matchup projection, the under on 3.5 might offer value. Tracking team-level shots-against data allows you to anticipate these matchup-driven adjustments before the market catches up.
Individual defenseman matchups add granularity. While team-level shot suppression provides a useful baseline, certain defensive pairs are significantly better or worse at limiting shots from opposing forwards. A top-line forward who is projected to face a weak second pair — perhaps because the opponent’s top pair will be matched against a different line — has an elevated shot projection that the generic team-level number may not capture. This level of matchup analysis requires more effort but yields more precise projections.
Overs vs. Unders: Where Does the Value Sit?
The shot prop market has a structural feature that creates a persistent lean. The betting public, like in most prop markets, tends to favor overs. Bettors enjoy rooting for things to happen — more shots, more goals, more action. This bias means that overs on shot props are more popular and, as a result, slightly overpriced at some books. Unders receive less action and may be underpriced, especially on nights when the matchup or situation suggests reduced shot volume.
That said, blindly betting unders on every shot prop is not a strategy. The value depends on the specific player, the specific matchup, and the specific price. A shot prop under is most attractive when a high-volume shooter is facing a strong shot-suppressing defense, is on the second night of a back-to-back (where offensive effort tends to dip), or has recently been moved off the first power-play unit — reducing his man-advantage shot opportunities.
Overs are most attractive in the opposite scenarios: a high-volume shooter against a porous defense, playing at home with full rest, on the first power-play unit, with a projected game script that favors his team being in the offensive zone for extended stretches. The compounding of favorable factors is what turns a marginal edge into a genuine value play.
One practical technique is to build a simple projection model. For each player you track, estimate his expected even-strength shots (based on shooting rate and projected ice time), add his expected power-play shots (based on PP unit and projected power-play opportunities against the specific opponent), and compare the total to the posted line. If your projection is 3.8 and the line is 2.5, the over is likely strong. If your projection is 2.9 and the line is 3.5, the under has value. The key is that your projection should be matchup-specific, not a flat season average.
The Boring Bet That Pays the Rent
Shot props will never trend on social media. Nobody posts a screenshot of their winning shot prop the way they post a last-second goal scorer hit. The market is quiet, the bets are unexciting, and the edge is measured in fractions of a shot that accumulate over hundreds of plays.
That is exactly why it works. The shot prop market is inefficient precisely because it does not attract the volume of attention and action that game-level markets do. Sportsbooks calibrate their main lines with sophisticated models and sharp market feedback. Shot props are set with less precision, adjusted less frequently, and bet by a smaller pool of recreational bettors who are more interested in parlaying shots with goal scorers than in analyzing shot rates against specific defensive matchups.
For the bettor willing to build a database of shooting rates, track line combinations and power-play deployments daily, and project matchup-specific shot totals for a stable of fifteen or twenty players, the shot prop market offers one of the most consistent edges in NHL betting. It is not glamorous. It is not fast. It is the kind of grinding, process-driven work that separates bettors who last from those who flame out. And lasting, more than anything else, is what matters in this game.
