

At some point, every serious bettor asks the same question: should I build a model? The answer depends on what you expect a model to do. If you expect it to print money and predict every game correctly, save yourself the effort. If you expect it to provide a systematic, unemotional framework for estimating probabilities and identifying value — one that you can refine over time based on data rather than gut feeling — then yes, building a model is one of the most valuable investments you can make in your betting process.
A hockey prediction model does not need to be complex. The most successful models used by non-professional bettors are relatively simple: a handful of well-chosen inputs, a transparent weighting system, and a rigorous testing process. Complexity adds the illusion of sophistication but often introduces noise that degrades predictive accuracy. Start simple. Add complexity only when you can prove it improves the output.
Framework of a Data-Driven NHL Model
A betting model takes measurable inputs about two teams, processes them through a set of rules or weights, and produces an output — typically a projected win probability for each team or a projected goal total for the game. You then compare that output to the sportsbook’s implied probability (derived from the odds) to identify value bets.
The framework has three steps. First, gather the inputs — the data points you believe are predictive of game outcomes. Second, weight those inputs to produce a combined estimate. Third, compare your estimate to the market price and bet when the gap exceeds your threshold.
The simplest version of this framework is a power rating system. You assign each team a numerical strength based on its underlying metrics, calculate the difference between the two teams’ ratings for a given game, and convert that difference into a projected win probability using a historical calibration curve. Teams with higher power ratings are projected to win more often, and the magnitude of the rating difference determines the degree of confidence.
This approach has been used in various forms for decades across multiple sports, and it works in hockey because the core principle is sound: teams that control play at a process level — generating more scoring chances, suppressing their opponents, and receiving strong goaltending — win more often over time. A power rating system that captures these process-level indicators will produce probability estimates that are more accurate than most casual bettors’ gut feelings and, importantly, more consistent.
Choosing Your Inputs
The inputs you select for your model define its perspective. Choose noisy inputs, and your model will produce noisy outputs. Choose stable, predictive inputs, and your model will produce reliable outputs. The goal is to find the smallest set of metrics that captures the most predictive information about team performance.
Five-on-five expected goals percentage (xGF%) is the single most predictive team-level metric in hockey. It measures what percentage of total expected goals a team generates when both teams are at full strength. A team with a 53% xGF% is generating more quality chances than it allows, and this metric has been shown to correlate strongly with future winning percentage. It should be the cornerstone of any NHL model.
Starting goaltender quality is the second essential input. As discussed throughout this series, the goaltending matchup is the most impactful single-game variable in hockey. Include each starting goaltender’s goals saved above expected (GSAx) over a recent window — the last twenty to thirty starts is a reasonable sample — as an input that adjusts your baseline team rating up or down depending on who is in net.
Schedule factors form the third input category. Is the team on the second night of a back-to-back? Is it a home or road game? How many days of rest has the team had? These factors have documented effects on win probability, and incorporating them into your model improves its accuracy on a game-by-game basis.
Recent form can serve as a fourth input, though it should be weighted carefully. A team’s performance over the last ten to fifteen games may reflect changes in form — injuries, lineup adjustments, tactical shifts — that the season-long metrics have not yet captured. But recent form is also the noisiest input because small samples amplify variance. A team that has gone 8-2 in its last ten might be genuinely playing better, or it might be riding unsustainable goaltending. Using recent xGF% rather than recent win-loss record filters out some of this noise.
Home ice adjustment is the fifth input. As covered earlier, home ice advantage is real but smaller than the market historically assumed. A fixed adjustment of three to four percentage points in win probability for the home team is a reasonable starting point, which you can refine based on your own data.
Tools for Building Your Model
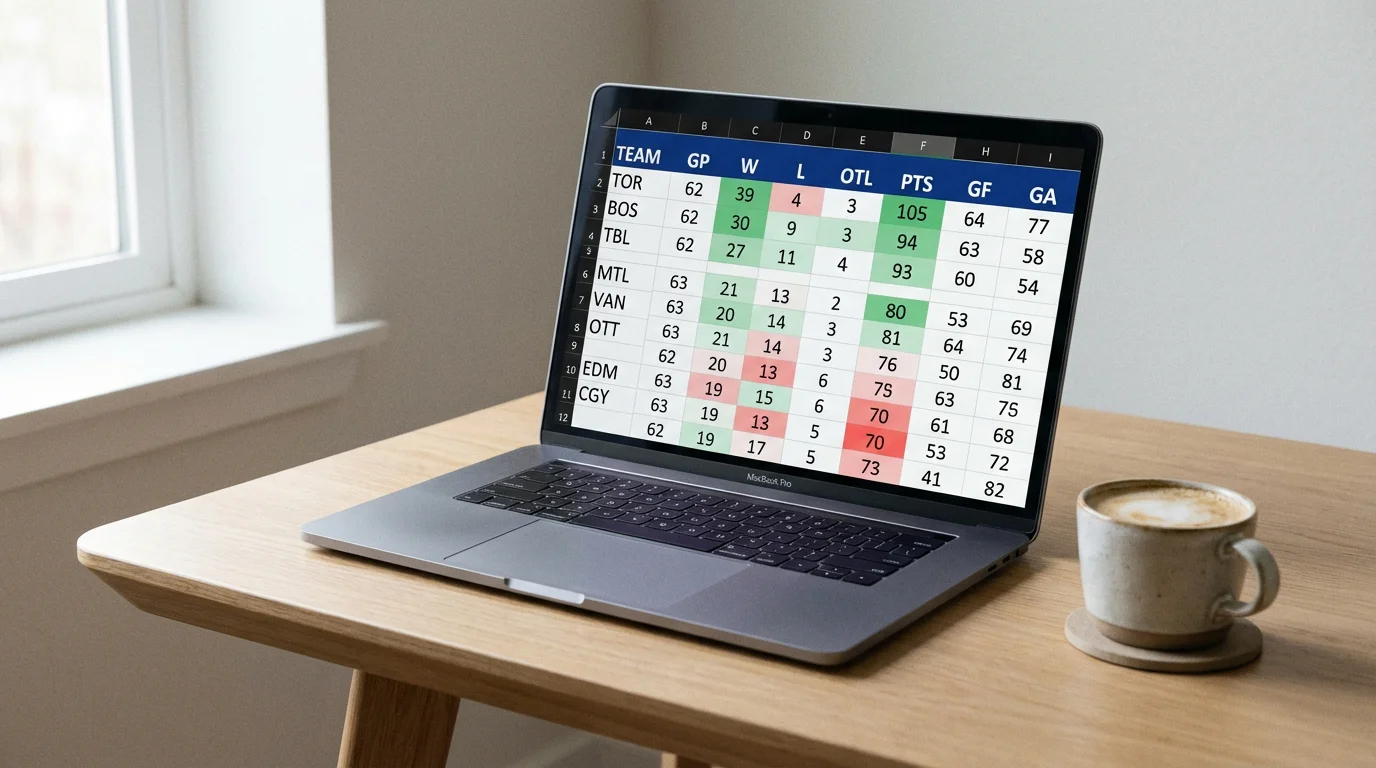
You do not need expensive software or a computer science degree to build a functional NHL model. A spreadsheet — Google Sheets or Excel — is sufficient for a basic power rating system. The data sources you need are freely available, and the calculations involved are arithmetic, not calculus.
For data, Natural Stat Trick provides comprehensive five-on-five and special teams metrics for every NHL team and player, including expected goals, Corsi, Fenwick, and high-danger scoring chances. MoneyPuck offers its own expected goals model with team and goaltender data. Evolving Hockey provides additional context with its proprietary models. Hockey Reference covers traditional stats, game logs, and schedule data. Between these four sites, you have access to everything you need to populate your model’s inputs.
The workflow is straightforward. Before each slate, pull the relevant metrics for every game: each team’s xGF%, the confirmed goaltenders’ GSAx, the schedule situation (rest days, back-to-back status), and any recent form indicators you have chosen to include. Plug these into your spreadsheet, apply your weights, and generate a projected win probability for each team. Compare your projections to the sportsbook’s implied probabilities, and flag any game where the gap exceeds your predetermined threshold — typically two to three percentage points.
The weighting of inputs is where art meets science. There is no single correct set of weights, and you will need to experiment. A reasonable starting point is to assign the largest weight to xGF% (perhaps 40-50% of the total rating), a significant weight to goaltender quality (25-30%), and smaller weights to schedule factors, recent form, and home ice (the remaining 20-35%). These weights should not be fixed permanently — they should be adjusted based on backtesting results.
For bettors who are comfortable with basic programming, Python or R offer more flexibility than a spreadsheet. You can automate data collection, run backtests more efficiently, and implement more sophisticated weighting schemes. But the programming path is not necessary for a functional model. Many profitable bettors run their entire operation from a well-structured spreadsheet with manual data entry. The tool matters less than the process.
Testing Your Model: Backtesting and Calibration
A model that has not been tested against historical data is not a model. It is a hypothesis. Backtesting is the process of running your model against past games — at least one full season, ideally three or more — to see whether its projections match the actual outcomes.
The primary test is calibration. If your model assigns a 60% win probability to a set of games, the teams in that set should have won approximately 60% of the time. If they won 55%, your model is overconfident at that probability level and needs adjustment. If they won 65%, your model is underconfident. Perfect calibration means that every probability bucket — 50%, 55%, 60%, 65%, and so on — matches the historical win rate within a reasonable margin of error.
Calibration is tested by grouping your historical projections into probability bins and comparing the projected win rate to the actual win rate in each bin. A calibration chart — with projected probability on the x-axis and actual win rate on the y-axis — should produce a line that runs close to the diagonal. Deviations from the diagonal indicate where your model’s estimates are too aggressive or too conservative.
The second test is profitability simulation. Take your model’s projections for a historical season, compare them to the actual closing lines for each game, and simulate a betting strategy: bet any game where your model’s projected probability exceeds the implied probability by at least two percentage points. Track the simulated results. If the strategy produces a positive return over the sample — accounting for vig — your model has demonstrated potential profitability. If it does not, the model needs refinement before you risk real money.
One critical caution: do not overfit. Overfitting occurs when you adjust your model’s parameters to perfectly match historical data, which makes it look great in backtesting but performs poorly on new games. The cure for overfitting is simplicity — fewer inputs, broader weight categories, and out-of-sample testing where you build the model on one set of seasons and test it on a different set. A model that performs well across multiple seasons without specific tuning for each one is more likely to be genuinely predictive.
A Model Is a Process, Not a Product
The biggest misconception about betting models is that they are finished products — you build one, turn it on, and it tells you what to bet. In reality, a model is a living process that requires continuous maintenance, evaluation, and adjustment. Teams change. Players get traded. Coaching strategies evolve. A model that was well-calibrated in October may need recalibration by January as the data landscape shifts.
Build periodic review into your modeling process. Every four to six weeks, recheck your calibration, update your inputs with the latest data, and evaluate whether any new variables should be added or existing ones removed. The trade deadline is a natural recalibration point, as roster changes can invalidate assumptions your model was built on.
And maintain humility about what your model can and cannot do. A model is not an oracle. It is a structured way of estimating probabilities that removes emotional bias and enforces consistency. It will produce bad recommendations on individual games — no model avoids that in a sport as volatile as hockey. But over hundreds of games, a well-calibrated model will produce better probability estimates than intuition alone, and better estimates mean more value bets, and more value bets mean a profitable season. That is the promise of model-based betting. Not certainty. Just a persistent, measurable advantage over doing it all in your head.
